Monitor and Check Experiments#
Warning
The autosubmit check command has been removed. To validate templates
without submitting jobs, run autosubmit inspect <EXPID> --quick.
Runtime validation during autosubmit run is still controlled by the
CHECK: job attribute (see below).
How to use check in running time:#
In jobs_<EXPID>.yml, you can set check (default true) to check the scripts during autosubmit run.
There are two parameters related to check:
CHECK: Controls the mechanism that allows replacing an unused variable with an empty string ( %_% substitution). It is TRUE by default.
SHOW_CHECK_WARNINGS: For debugging purposes. It will print a lot of information regarding variables and substitution if it is set to TRUE.
CHECK: TRUE or FALSE or ON_SUBMISSION # Default is TRUE
SHOW_CHECK_WARNINGS: TRUE or FALSE # Default is FALSE
CHECK: TRUE # Static templates (existing on `autosubmit create`). Used to substitute empty variables

CHECK: ON_SUBMISSION # Dynamic templates (generated on running time). Used to substitute empty variables.

CHECK: FALSE # Used to disable this substitution.
SHOW_CHECK_WARNINGS: TRUE # Shows a LOT of information. Disabled by default.
For example:
LOCAL_SETUP:
    FILE: filepath_that_exists
    PLATFORM: LOCAL
    WALLCLOCK: 05:00
    CHECK: TRUE
    SHOW_CHECK_WARNINGS: TRUE
    ...
SIM:
    FILE: filepath_that_no_exists_until_setup_is_processed
    PLATFORM: bsc_es
    DEPENDENCIES: LOCAL_SETUP SIM-1
    RUNNING: chunk
    WALLCLOCK: 05:00
    CHECK: ON_SUBMISSION
    SHOW_CHECK_WARNINGS: FALSE
    ...
How to generate cmd files#
The inspect command generates the .cmd files for jobs in an experiment without
submitting them. This allows you to preview the rendered scripts and verify that all
parameters are correctly substituted prior to submission.
To generate the cmd files of the current non-active jobs experiment, use the command:
autosubmit inspect EXPID
EXPID is the experiment identifier.
Options:
$ autosubmit inspect -h

Output:
usage: autosubmit inspect [-h] [-nt] [-f] [-cw] [-v] [-q] [-fl LIST]
                          [-fc FILTER_CHUNKS]
                          [-fs {Any,READY,COMPLETED,WAITING,SUSPENDED,FAILED,UNKNOWN}]
                          [-ft FILTER_TYPE]
                          expid

Generate all .cmd files

positional arguments:
  expid                 experiment identifier

optional arguments:
  -h, --help            show this help message and exit
  -nt, --notransitive   Disable transitive reduction
  -f, --force           Overwrite all cmd
  -cw, --check_wrapper  Generate possible wrapper in the current workflow
  -v, --update_version  Update experiment version
  -q, --quick           Only checks one job per each section
  -fl LIST, --list LIST
                        Supply the list of job names to be filtered. Default =
                        "Any". LIST = "b037_20101101_fc3_21_sim
                        b037_20111101_fc4_26_sim"
  -fc FILTER_CHUNKS, --filter_chunks FILTER_CHUNKS
                        Supply the list of chunks to filter the list of jobs.
                        Default = "Any". LIST = "[ 19601101 [ fc0 [1 2 3 4]
                        fc1 [1] ] 19651101 [ fc0 [16-30] ] ]"
  -fs {Any,READY,COMPLETED,WAITING,SUSPENDED,FAILED,UNKNOWN}, --filter_status {Any,READY,COMPLETED,WAITING,SUSPENDED,FAILED,UNKNOWN}
                        Select the original status to filter the list of jobs
  -ft FILTER_TYPE, --filter_type FILTER_TYPE
                        Select the job type to filter the list of jobs
Examples:
with autosubmit.lock present or not:
autosubmit inspect <EXPID>
with autosubmit.lock present or not:
autosubmit inspect <EXPID> -f
without autosubmit.lock:
autosubmit inspect <EXPID> -fl [-fc,-fs or -ft]
To generate cmd for wrappers:
autosubmit inspect <EXPID> -cw -f
With autosubmit.lock and no (-f) force, it will only generate all files that are not submitted.
Without autosubmit.lock, it will generate all unless filtered by -fl,-fc,-fs or -ft.
The following filters can be combined to select jobs to inspect.
FILTER |
Meaning |
Example of VALUE_TO_FILTER |
|---|---|---|
-fl |
filter by job name |
|
-fs |
filter by job status |
|
-ft |
filter by job type (and optionally split) |
|
-fc |
filter by chunk/section/split |
|
If multiple filters are provided (-fl, -fs, -ft, -fc), they will be combined as logical AND, meaning that only jobs matching ALL specified filters will be selected for inspection.
To combine multiple filters:
autosubmit inspect <EXPID> \
    -fc "[20200101 [ fc0 [1] ] ]" \
    -fs WAITING \
    -ft LOCALJOB \
    -fl "<EXPID>_20200101_fc0_1_1_LOCALJOB"
To generate cmd only for one job per section:
autosubmit inspect <EXPID> -q
How to monitor an experiment#
The monitor command allows you to visualize the experiment workflow and shows each job’s status (color coded) or stores a text file with the status of each job. You can select which jobs to monitor by using optional filters and grouping options.
To monitor the status of the experiment, use the command:
autosubmit monitor EXPID
EXPID is the experiment identifier.
Options:
$ autosubmit monitor -h

Output:
usage: autosubmit monitor [-h] [-o {pdf,png,ps,svg,txt}]
                          [-group_by {date,member,chunk,split,automatic}]
                          [-expand EXPAND] [-expand_status EXPAND_STATUS]
                          [--hide_groups] [-cw] [-fl LIST] [-fc FILTER_CHUNKS]
                          [-fs {Any,READY,COMPLETED,WAITING,SUSPENDED,FAILED,UNKNOWN}]
                          [-ft FILTER_TYPE] [--hide] [-txt | -txtlog] [-nt]
                          [-v] [-p]
                          expid

plots specified experiment

positional arguments:
  expid                 experiment identifier

optional arguments:
  -h, --help            show this help message and exit
  -o {pdf,png,ps,svg,txt}, --output {pdf,png,ps,svg,txt}
                        chooses type of output for generated plot
  -group_by {date,member,chunk,split,automatic}
                        Groups the jobs automatically or by date, member,
                        chunk or split
  -expand EXPAND        Supply the list of dates/members/chunks to filter the
                        list of jobs. Default = "Any". LIST = "[ 19601101 [
                        fc0 [1 2 3 4] fc1 [1] ] 19651101 [ fc0 [16-30] ] ]"
  -expand_status EXPAND_STATUS
                        Select the stat uses to be expanded
  --hide_groups         Hides the groups from the plot
  -cw, --check_wrapper  Generate possible wrapper in the current workflow
  -fl LIST, --list LIST
                        Supply the list of job names to be filtered. Default =
                        "Any". LIST = "b037_20101101_fc3_21_sim
                        b037_20111101_fc4_26_sim"
  -fc FILTER_CHUNKS, --filter_chunks FILTER_CHUNKS
                        Supply the list of chunks to filter the list of jobs.
                        Default = "Any". LIST = "[ 19601101 [ fc0 [1 2 3 4]
                        fc1 [1] ] 19651101 [ fc0 [16-30] ] ]"
  -fs {Any,READY,COMPLETED,WAITING,SUSPENDED,FAILED,UNKNOWN}, --filter_status {Any,READY,COMPLETED,WAITING,SUSPENDED,FAILED,UNKNOWN}
                        Select the original status to filter the list of jobs
  -ft FILTER_TYPE, --filter_type FILTER_TYPE
                        Select the job type to filter the list of jobs
  --hide                hides plot window
  -txt, --text          Generates only txt status file
  -txtlog, --txt_logfiles
                        Generates only txt status file(AS < 3.12b behaviour)
  -nt, --notransitive   Disable transitive reduction
  -v, --update_version  Update experiment version
  -p, --profile         Prints performance parameters of the execution of this
                        command.
Example:
autosubmit monitor <EXPID>
The location where the user can find the generated plots with date and timestamp can be found below:
<experiments_directory>/<EXPID>/plot/<EXPID>_<DATE>_<TIME>.pdf
The location where the user can find the txt output containing the status of each job and the path to out and err log files.
<experiments_directory>/<EXPID>/status/<EXPID>_<DATE>_<TIME>.txt
The following filters can be combined to select jobs to monitor.
FILTER |
Meaning |
Example of VALUE_TO_FILTER |
|---|---|---|
-fl |
filter by job name |
|
-fs |
filter by job status |
|
-ft |
filter by job type (and optionally split) |
|
-fc |
filter by chunk/section/split |
|
If multiple filters are provided (-fl, -fs, -ft, -fc), they will be combined as logical AND, meaning that only jobs matching ALL specified filters will be selected for monitoring.
Example of combined filters:
autosubmit monitor <EXPID> \
    -fc "[20200101 [ fc0 [1] ] ]" \
    -fs WAITING \
    -ft LOCALJOB \
    -fl "<EXPID>_20200101_fc0_1_1_LOCALJOB"
Possible job status#
Autosubmit jobs can move through the following statuses.
WAITING- The job is waiting for dependencies to reach the required conditions.DELAYED- The job is temporarily postponed and will be reconsidered later.PREPARED- The job is prepared for submission.READY- The job is eligible to be submitted.SUBMITTED- The job has been submitted to the platform.HELD- The job is held in the queue, for example by scheduler policy or manual hold.QUEUING- The job is queued in the scheduler and waiting for resources.RUNNING- The job is currently executing.SKIPPED- The job execution was intentionally skipped.FAILED- The job execution finished with an error.UNKNOWN- Autosubmit could not determine the current job state from the platform.COMPLETED- The job finished successfully.SUSPENDED- The running or queued job was suspended.
Hint
Very large plots may be a problem for some pdf and image viewers. If you are having trouble with your usual monitoring tool, try using svg output and opening it with Google Chrome with the SVG Navigator extension installed.
In order to understand more the grouping options, please check Grouping jobs.
Grouping jobs#
Other than the filters, another option for large workflows is to group jobs. This option is available with the group_by keyword, which can receive the values {date,member,chunk,split,automatic}.
For the first 4 options, the grouping criteria is explicitly defined {date,member,chunk,split}.
In addition to that, it is possible to expand some dates/members/chunks that would be grouped either/both by status or/and by specifying the date/member/chunk not to group.
The syntax used in this option is almost the same as for the filters, in the format of [ date1 [ member1 [ chunk1 chunk2 ] member2 [ chunk3 ... ] ... ] date2 [ member3 [ chunk1 ] ] ... ]
Important
The grouping option is also in autosubmit monitor, create, setstatus and recovery
Examples:
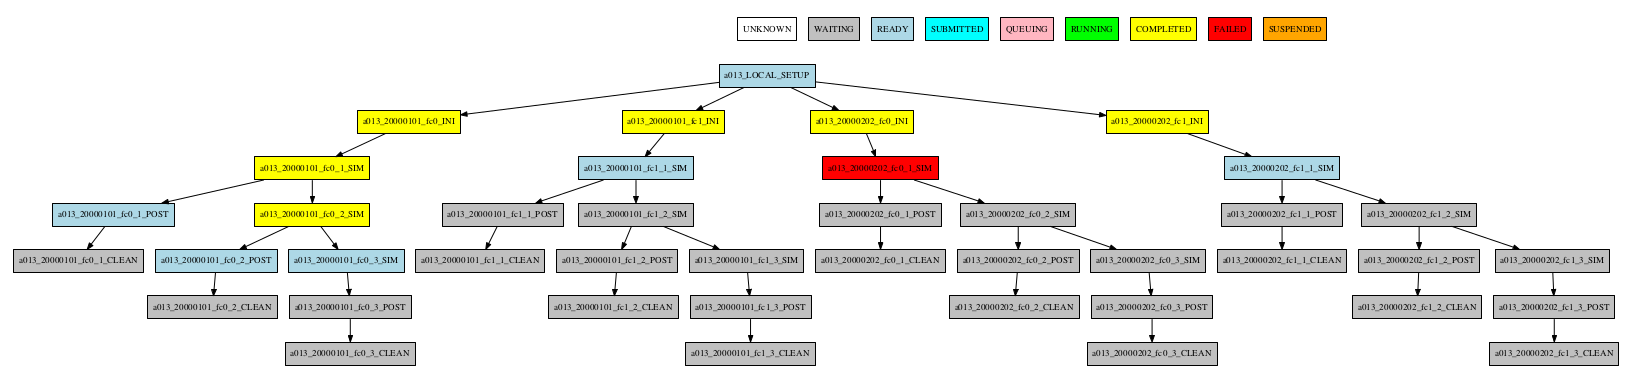
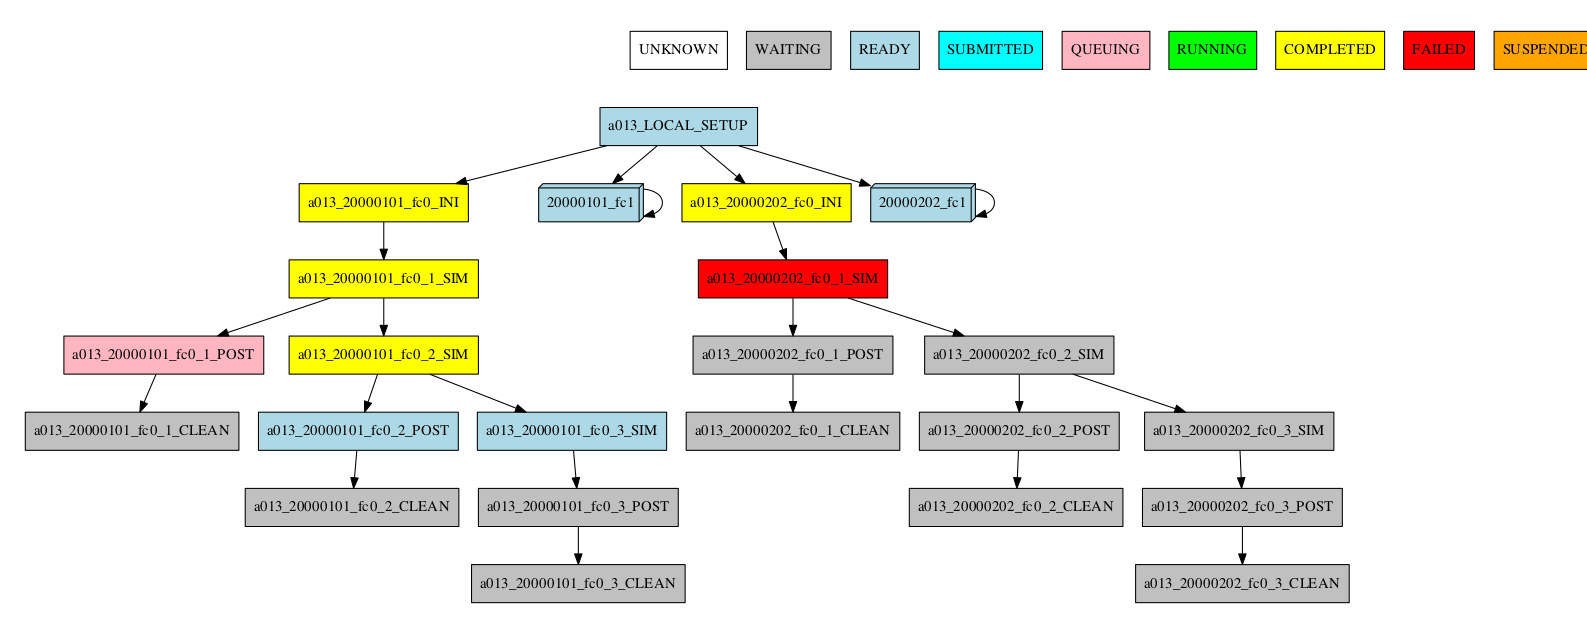
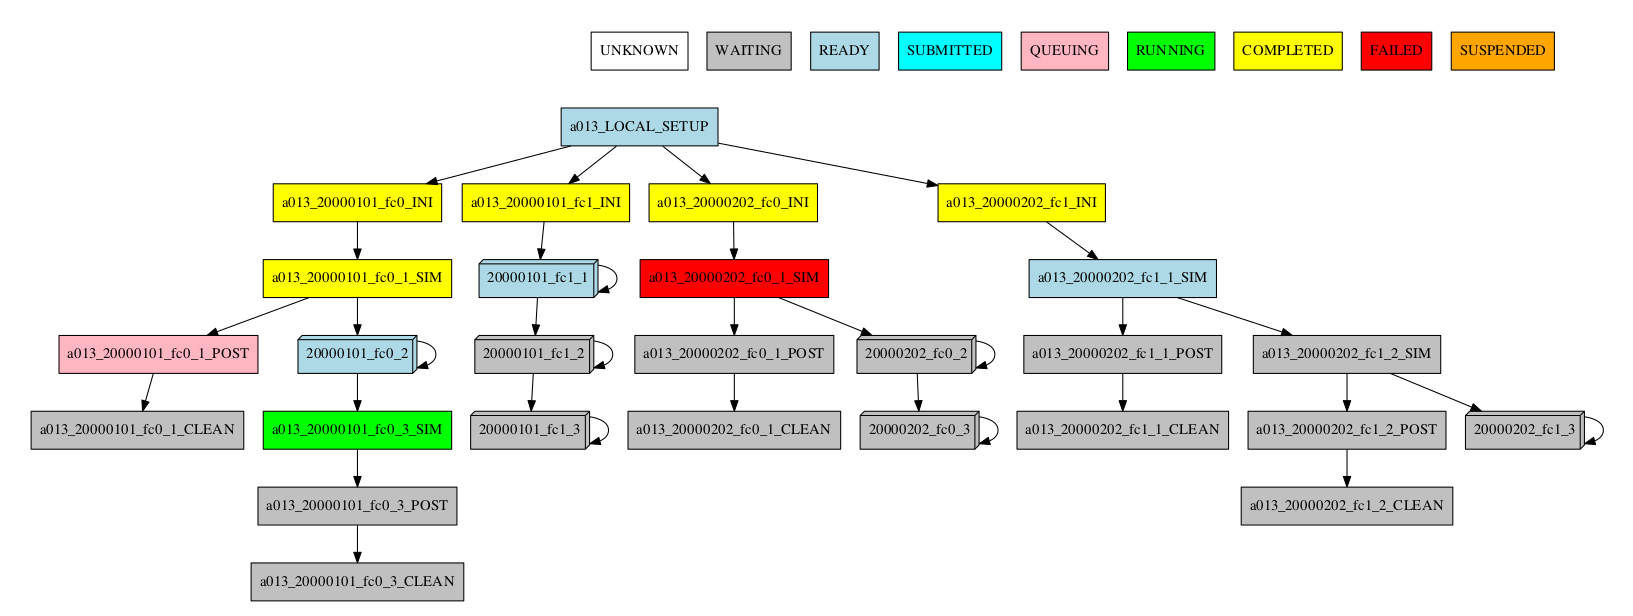
Consider the following workflow:
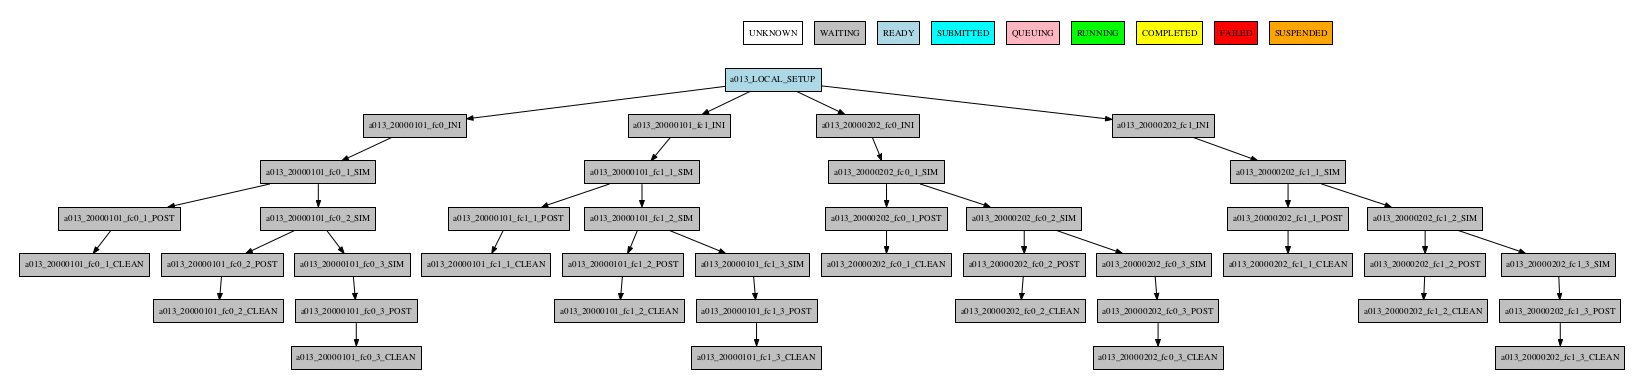
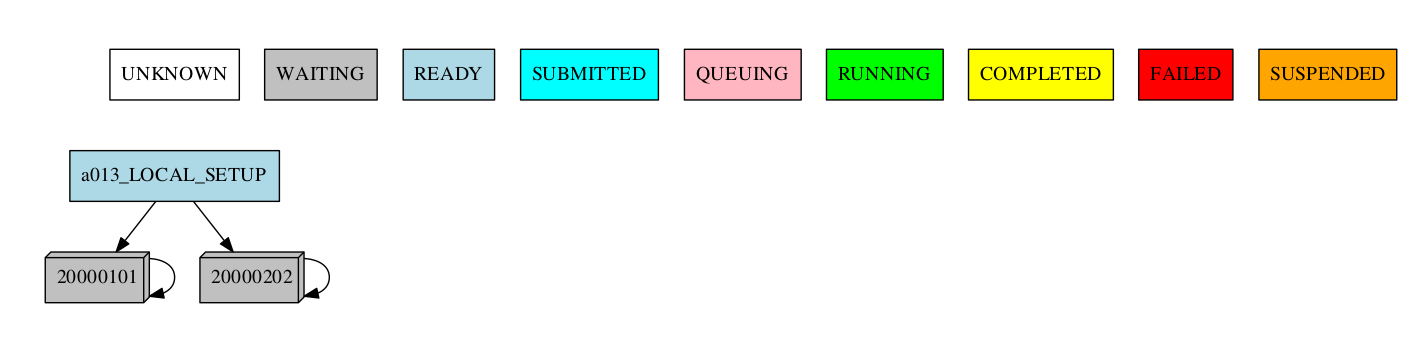
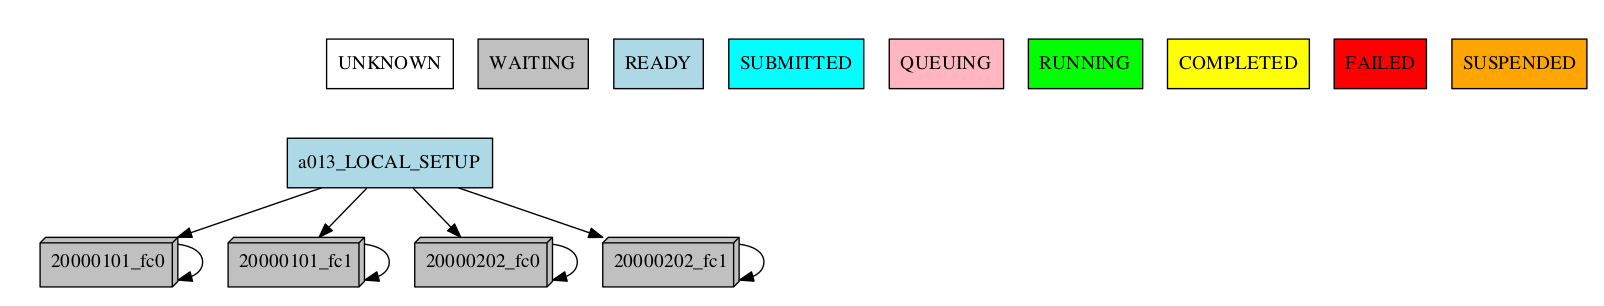
Group by date
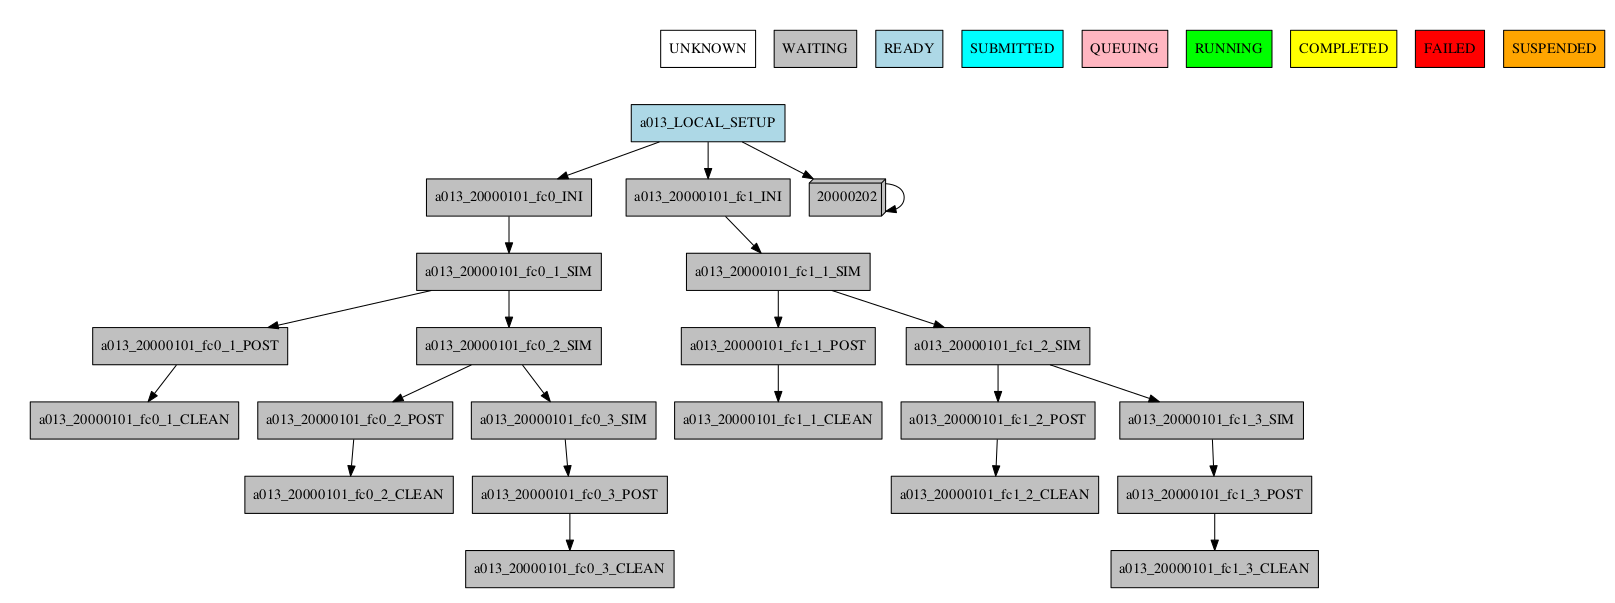
-group_by=date
-group_by=date -expand="[ 20000101 ]"
-group_by=date -expand_status="FAILED RUNNING"
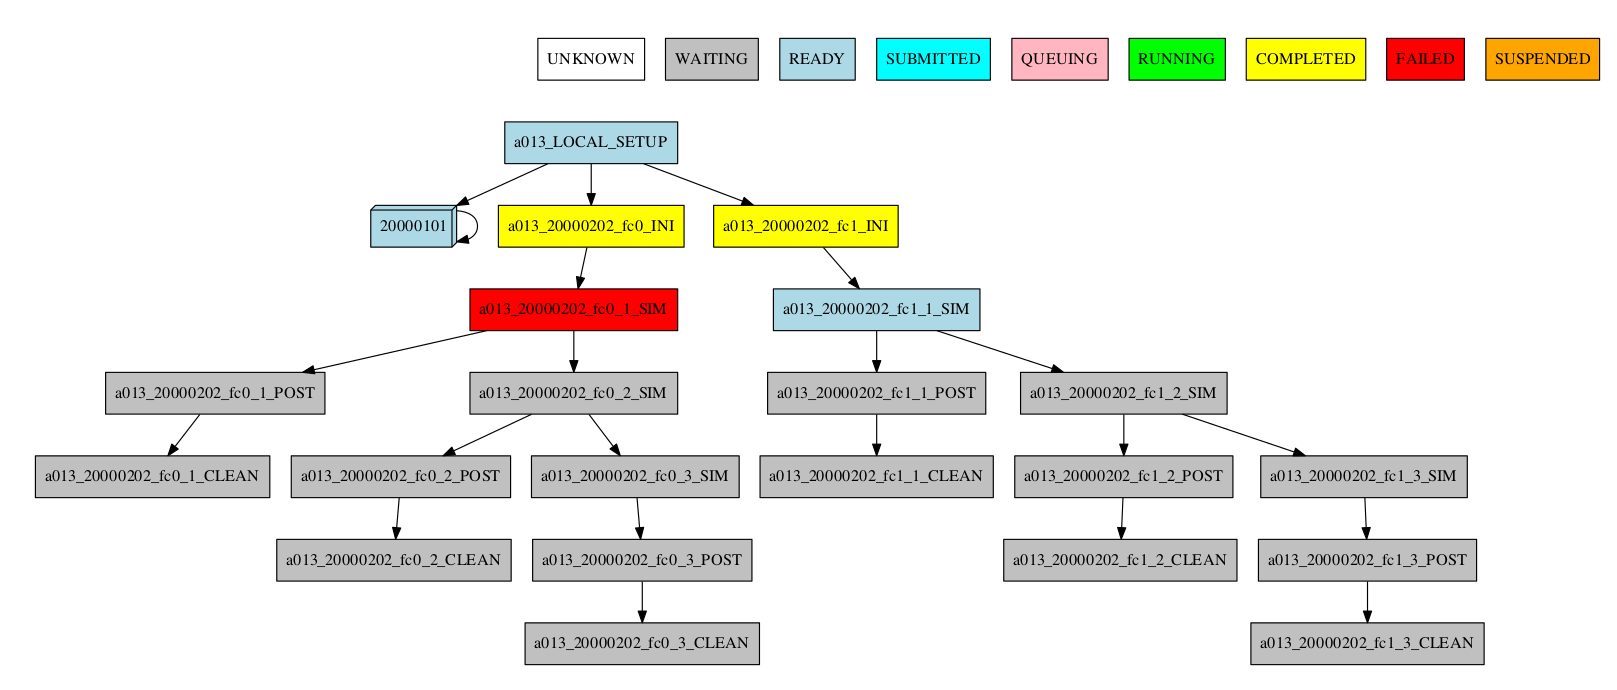
-group_by=date -expand="[ 20000101 ]" -expand_status="FAILED RUNNING"
Group by member
-group_by=member
-group_by=member -expand="[ 20000101 [ fc0 fc1 ] 20000202 [ fc0 ] ]"
-group_by=member -expand_status="FAILED QUEUING"
-group_by=member -expand="[ 20000101 [ fc0 fc1 ] 20000202 [ fc0 ] ]" -expand_status="FAILED QUEUING"
Group by chunk
-group_by=chunk
TODO: Add group_chunk.png figure.
Synchronize jobs
If jobs are synchronized between members or dates, then a connection between groups is shown:
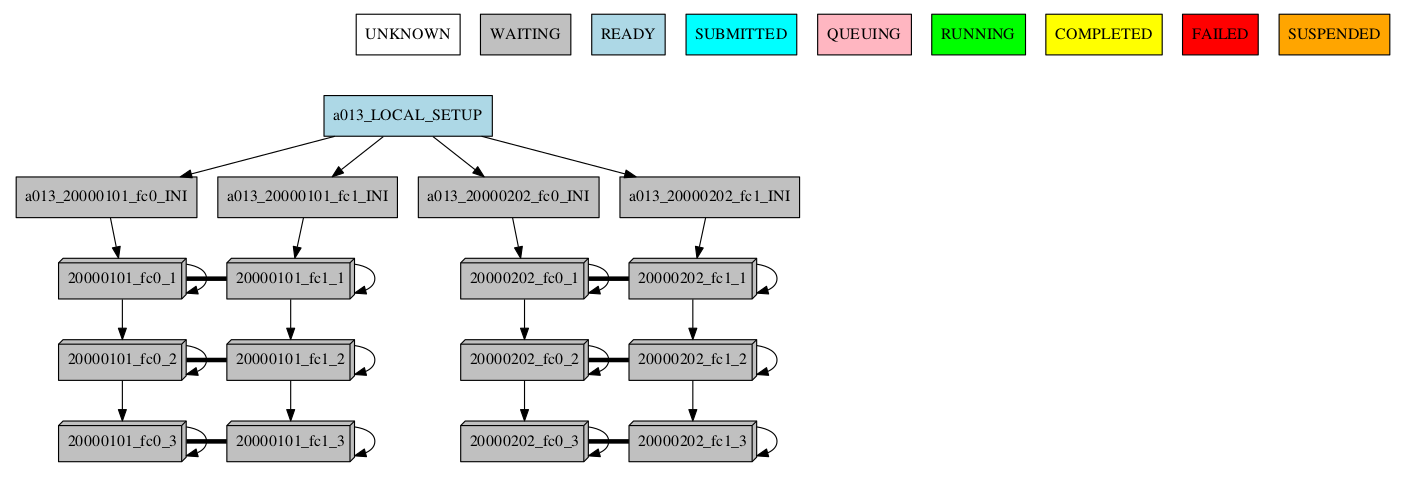
-group_by=chunk -expand="[ 20000101 [ fc0 [1 2] ] 20000202 [ fc1 [2] ] ]"
-group_by=chunk -expand_status="FAILED RUNNING"
-group_by=chunk -expand="[ 20000101 [ fc0 [1] ] 20000202 [ fc1 [1 2] ] ]" -expand_status="FAILED RUNNING"
Group by split
If there are chunk jobs that are split, the splits can also be grouped.
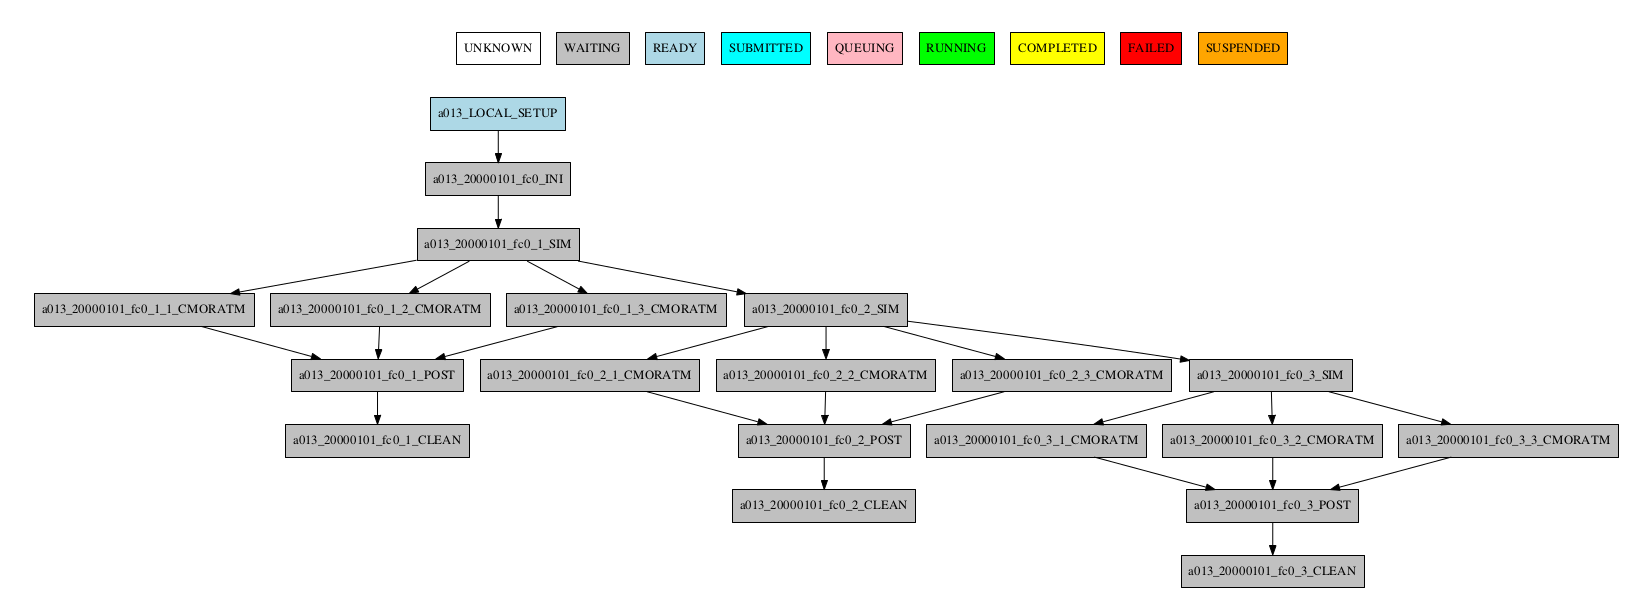
-group_by=split

Understanding the group status
If there are jobs with different status grouped together, the status of the group is determined as follows: If there is at least one job that failed, the status of the group will be FAILED. If there are no failures but there is at least one job running, the status will be RUNNING. The same idea applies following the hierarchy: SUBMITTED, QUEUING, READY, WAITING, SUSPENDED, UNKNOWN. If the group status is COMPLETED, it means that all jobs in the group were completed.
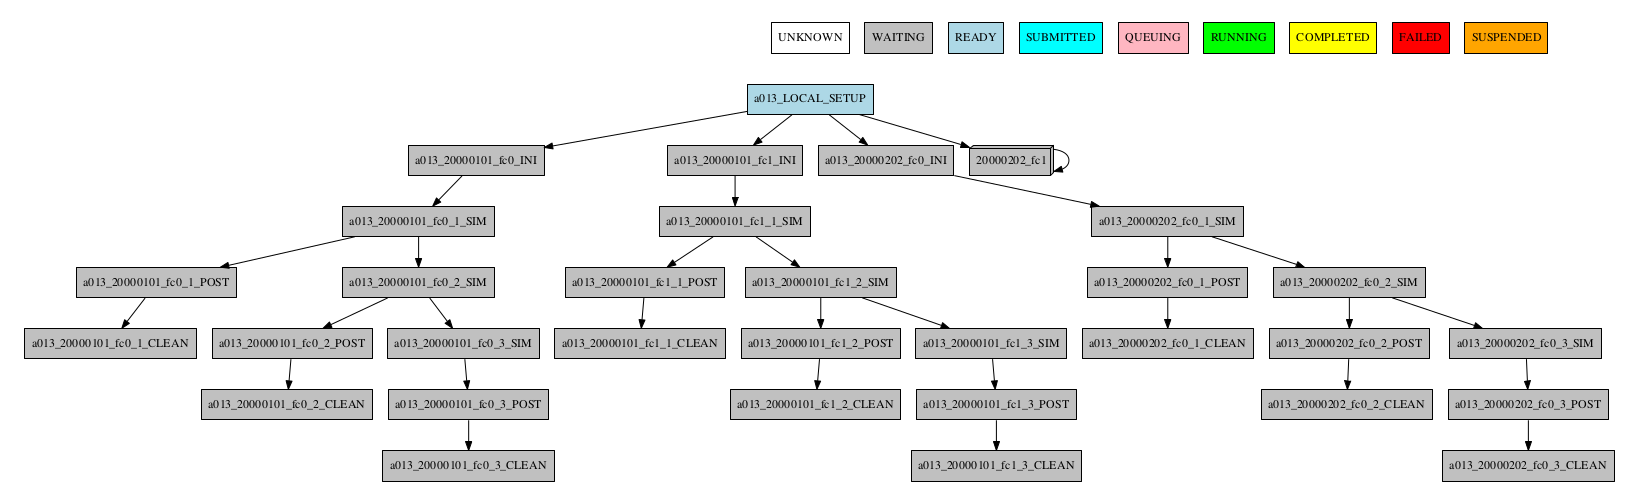
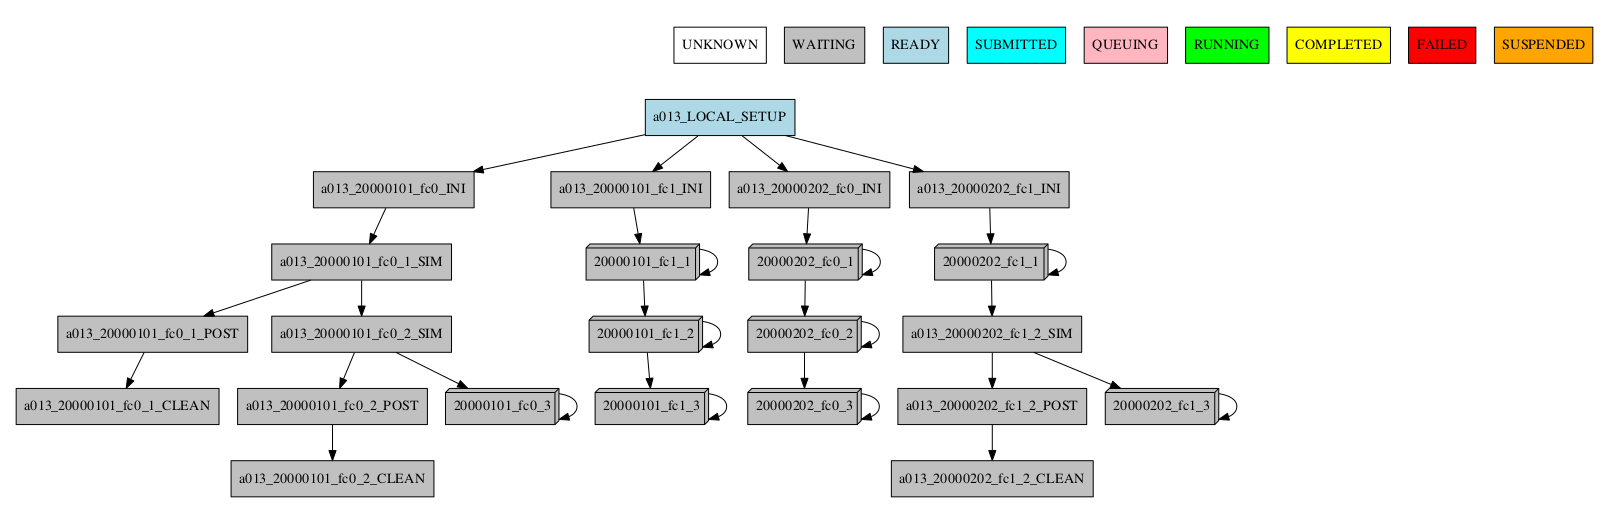
Automatic grouping
For the automatic grouping, the groups are created by collapsing the split->chunk->member->date that share the same status (following this hierarchy). The following workflow automatic created the groups 20000101_fc0, since all the jobs for this date and member were completed, 20000101_fc1_3, 20000202_fc0_2, 20000202_fc0_3 and 20000202_fc1, as all the jobs up to the respective group granularity share the same - waiting - status.
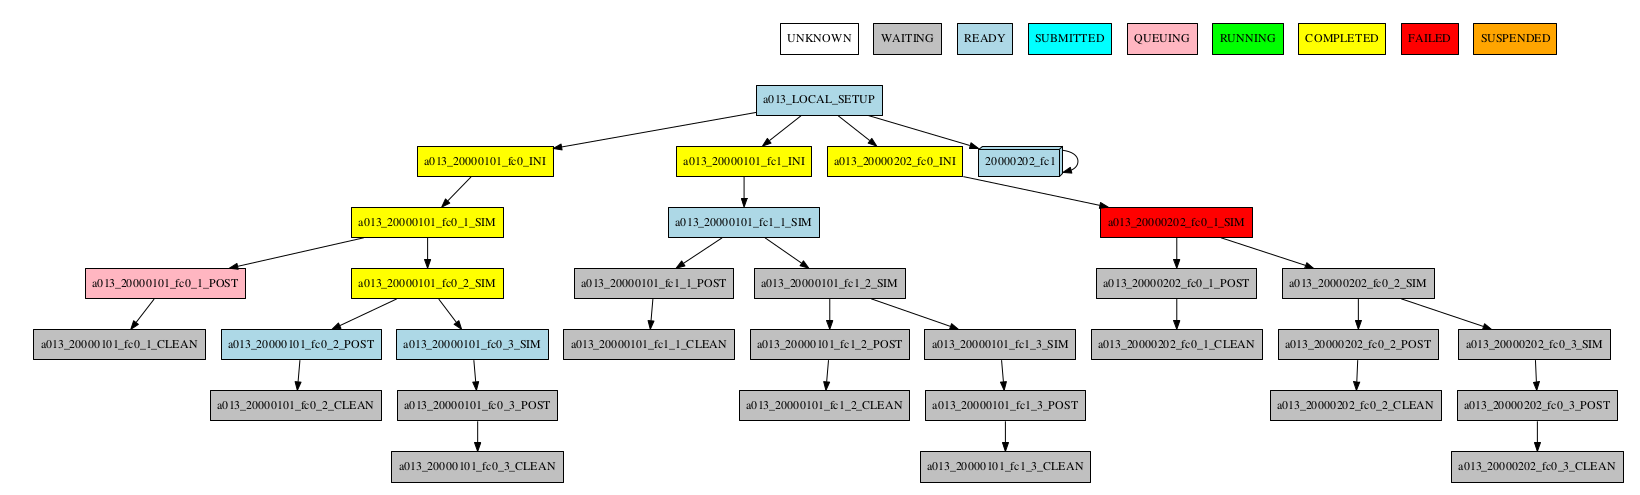
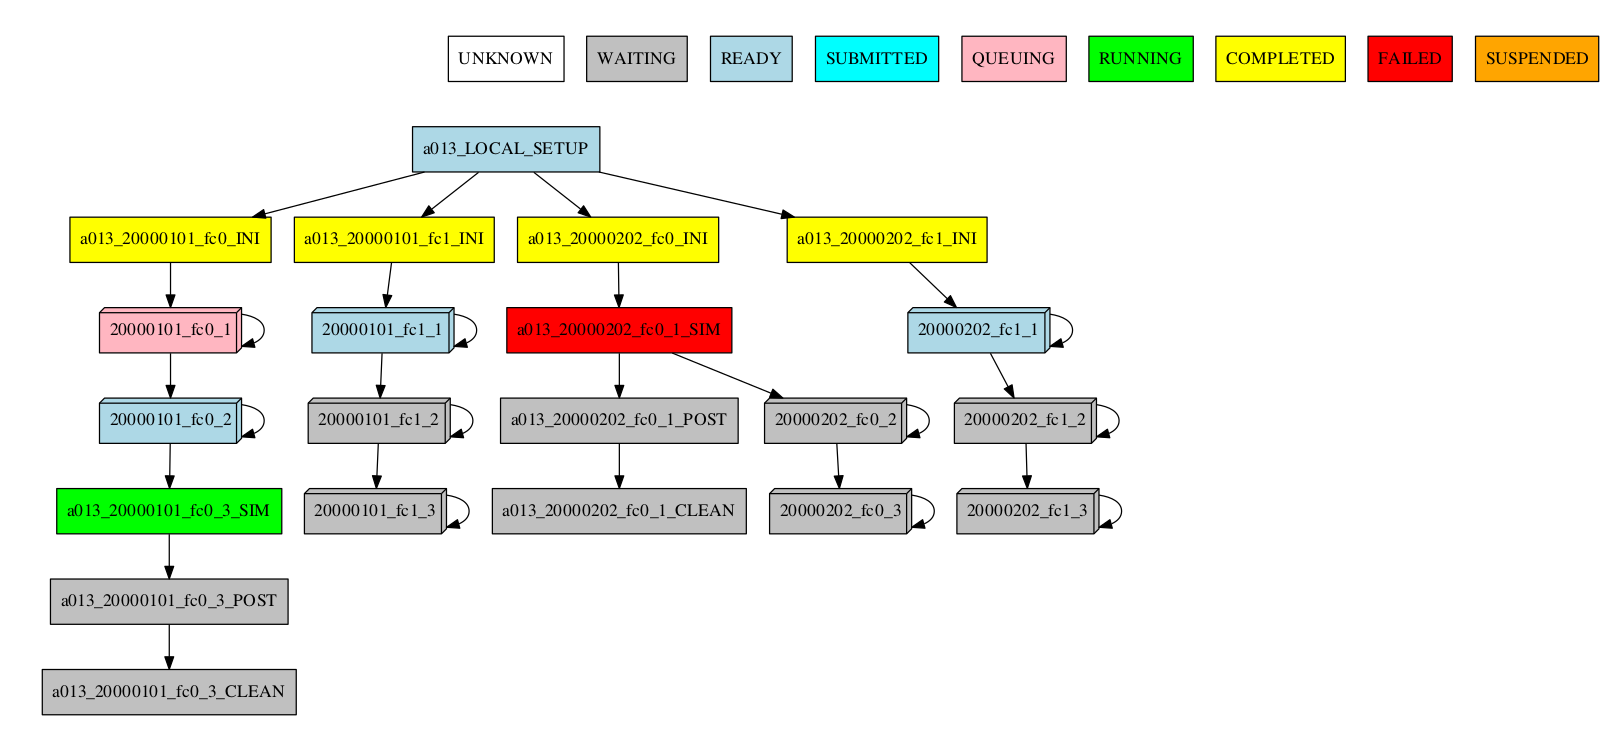
For example:
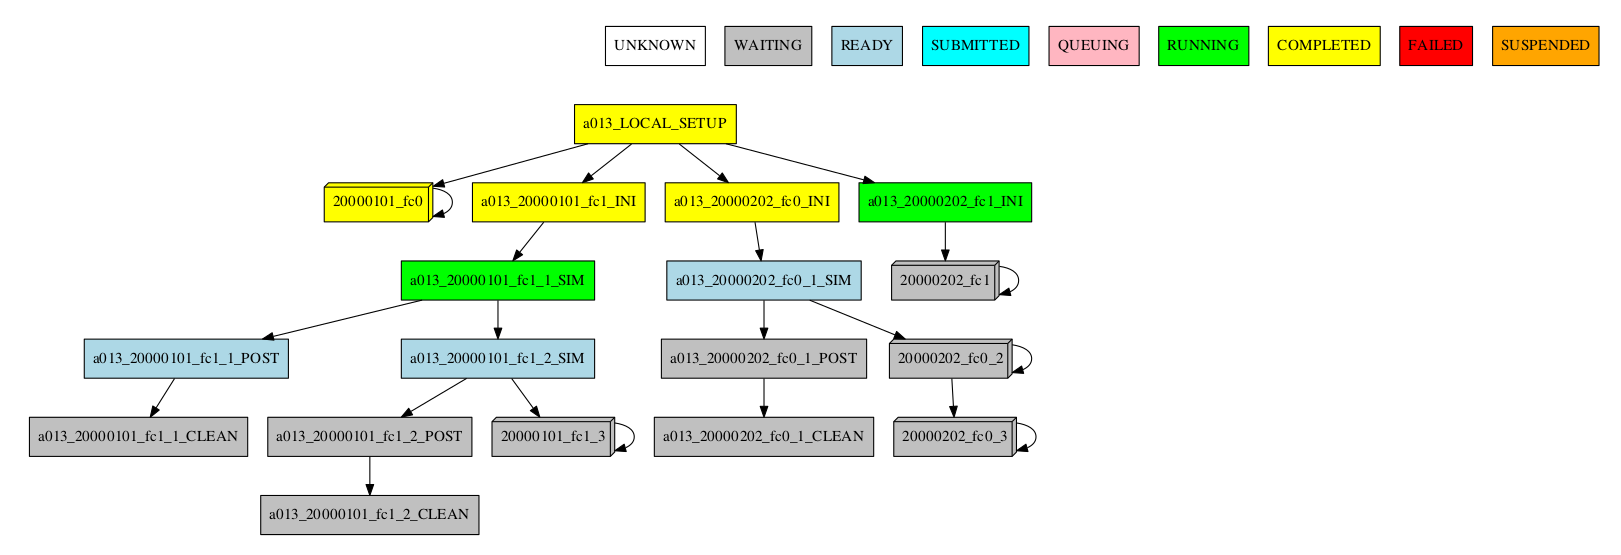
Especially in the case of monitoring an experiment with a very large number of chunks, it might be useful to hide the groups created automatically. This allows to better visualize the chunks in which there are jobs with different status, which can be a good indication that there is something currently happening within such chunks (jobs ready, submitted, running, queueing or failed).
-group_by=automatic --hide_groups
How to profile Autosubmit while monitoring an experiment#
Autosubmit offers the possibility to profile the execution of the monitoring process. To enable the
profiler, just add the --profile (or -p) flag to your autosubmit monitor command, as in
the following example:
autosubmit monitor --profile EXPID
Note
Remember that the purpose of this profiler is to measure the performance of Autosubmit, not the jobs it runs.
This profiler uses Python’s cProfile and psutil modules to generate a report with simple CPU and
memory metrics which will be displayed in your console after the command finishes, as in the example below:
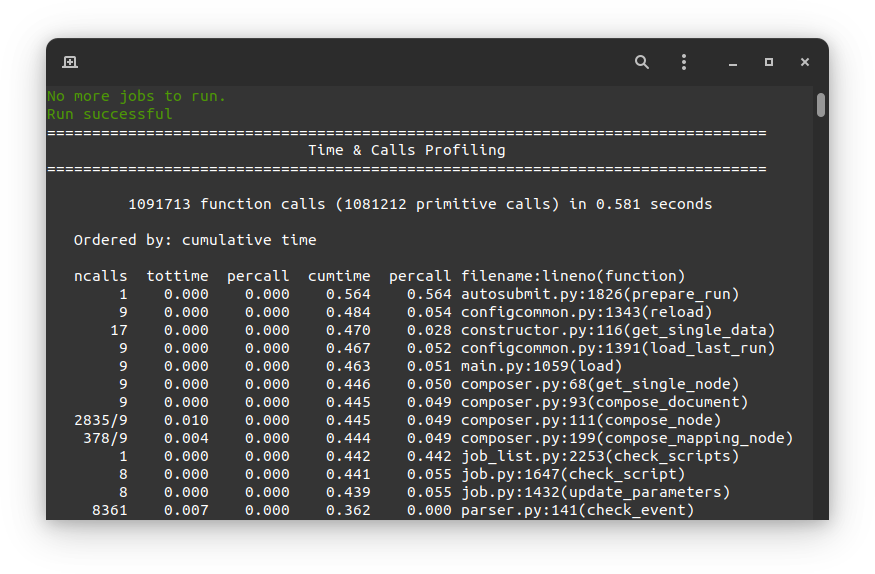
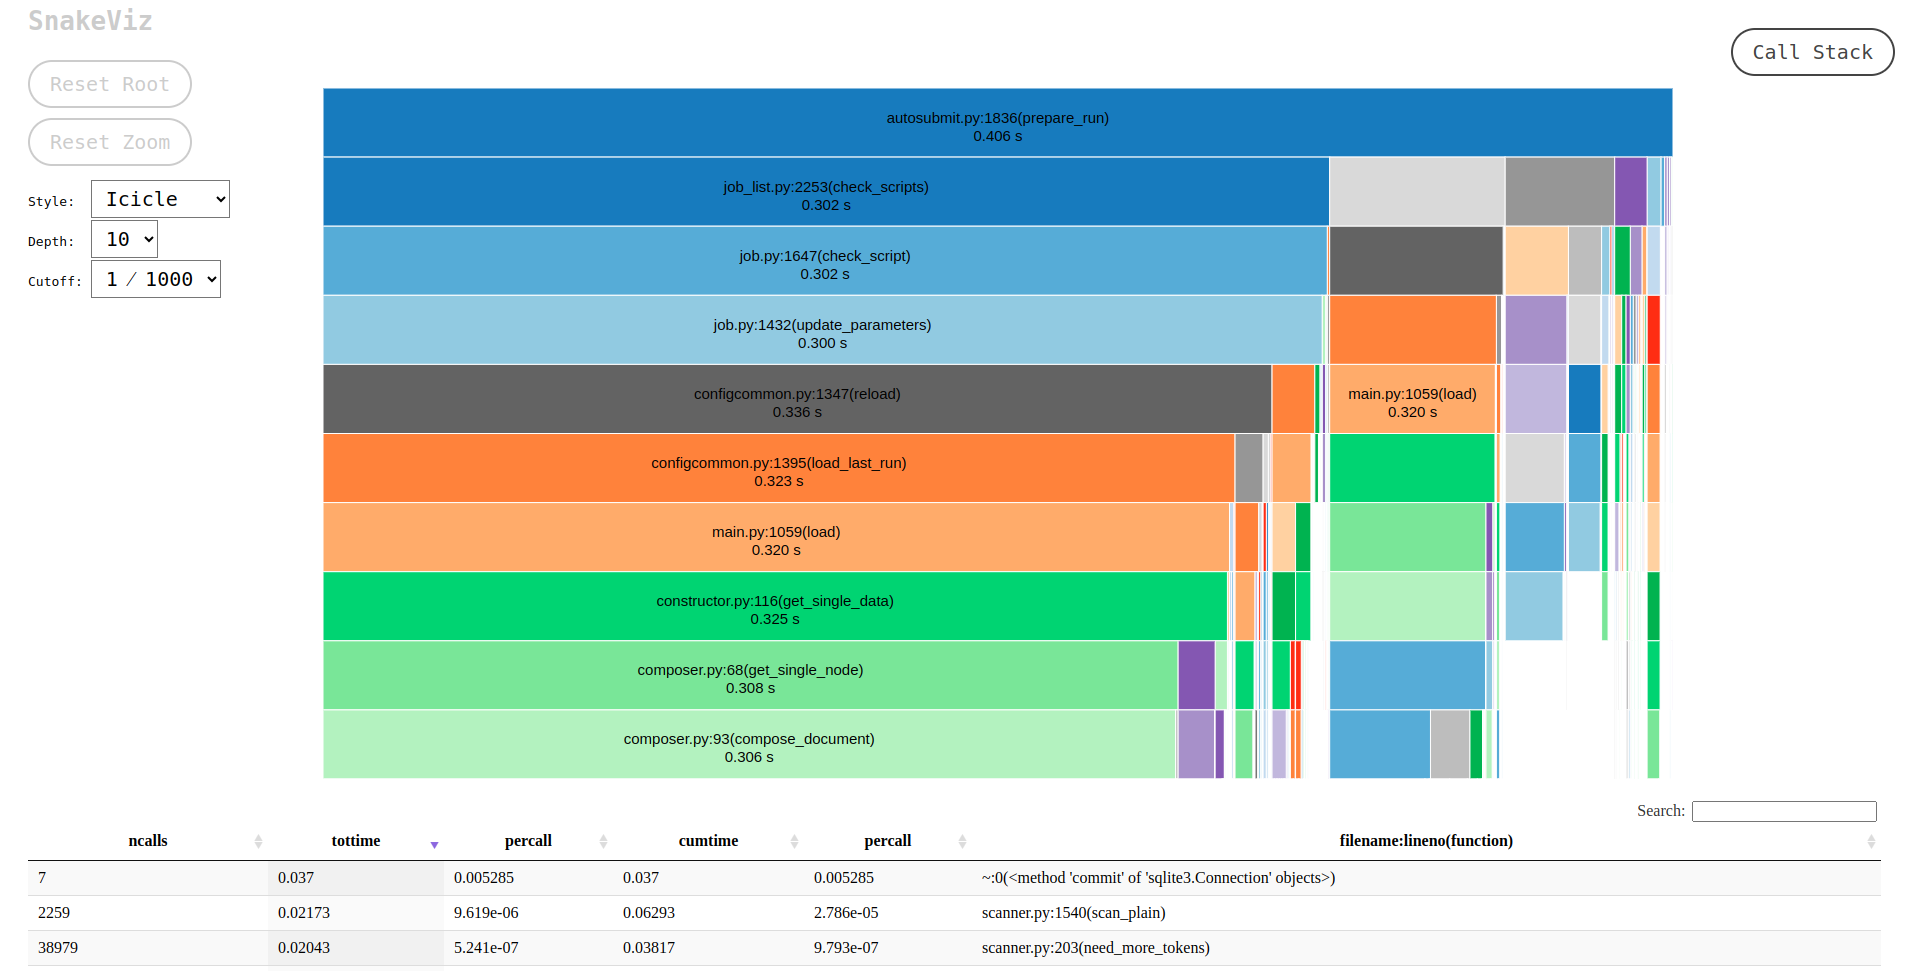
The profiler output is also saved in <EXPID>/tmp/profile. There you will find two files, the
report in plain text format and a .prof binary which contains the CPU metrics. We highly recommend
using SnakeViz to visualize this file, as follows:
For more detailed documentation about the profiler, please visit this page.
How to get details about the experiment#
To get details about the experiment, use the command:
autosubmit describe [EXPID] [-u USERNAME]
EXPID is the experiment identifier, can be a list of expid separated by comma or spaces -u USERNAME is the username of the user who submitted the experiment.
It displays information about the experiment. Currently it describes owner,description_date,model,branch and hpc
Options:
$ autosubmit describe -h

Output:
usage: autosubmit describe [-h] [-u USER] [-v] [expid]

Show details for specified experiment

positional arguments:
  expid                 experiment identifier, can be a list of expid
                        separated by comma or spaces

optional arguments:
  -h, --help            show this help message and exit
  -u USER, --user USER  username, default is current user or listed expid
  -v, --update_version  Update experiment version
Examples:
autosubmit describe <EXPID>
autosubmit describe "<EXPID> <EXPID>"
autosubmit describe <EXPID>,<EXPID>
autosubmit describe -u dbeltran
How to monitor job statistics#
The following command could be adopted to generate the plots for visualizing the jobs statistics of the experiment at any instance:
autosubmit stats EXPID
EXPID is the experiment identifier.
Options:
$ autosubmit stats -h

Output:
usage: autosubmit stats [-h] [-ft FILTER_TYPE] [-fp FILTER_PERIOD]
                        [-o {pdf,png,ps,svg}] [--section_summary]
                        [--jobs_summary] [--hide] [-nt] [-v]
                        expid

plots statistics for specified experiment

positional arguments:
  expid                 experiment identifier

optional arguments:
  -h, --help            show this help message and exit
  -ft FILTER_TYPE, --filter_type FILTER_TYPE
                        Select the job type to filter the list of jobs
  -fp FILTER_PERIOD, --filter_period FILTER_PERIOD
                        Select the period to filter jobs from current time to
                        the past innumber of hours back (must be greater than
                        0)
  -o {pdf,png,ps,svg}, --output {pdf,png,ps,svg}
                        type of output for generated plot
  --section_summary     Includes section summary in the plot
  --jobs_summary        Includes jobs summary in the plot
  --hide                hides plot window
  -nt, --notransitive   Disable transitive reduction
  -v, --update_version  Update experiment version
Example:
autosubmit stats <EXPID>
The location where user can find the generated plots with date and timestamp can be found below:
<experiments_directory>/<EXPID>/plot/<EXPID>_statistics_<DATE>_<TIME>.pdf
For including the summaries:
autosubmit stats --section_summary --jobs_summary <EXPID>
The location will be:
<experiments_directory>/<EXPID>/stats/<EXPID>_section_summary_<DATE>_<TIME>.pdf
<experiments_directory>/<EXPID>/stats/<EXPID>_jobs_summary_<DATE>_<TIME>.pdf
Console output description#
Example:
Period: 2021-04-25 06:43:00 ~ 2021-05-07 18:43:00
Submitted (#): 37
Run  (#): 37
Failed  (#): 3
Completed (#): 34
Queueing time (h): 1.61
Expected consumption real (h): 2.75
Expected consumption CPU time (h): 3.33
Consumption real (h): 0.05
Consumption CPU time (h): 0.06
Consumption (%): 1.75
Where:
Period: Requested time frame.
Submitted: Total number of attempts that reached the SUBMITTED status.
Run: Total number of attempts that reached the RUNNING status.
Failed: Total number of FAILED attempts of running a job.
Completed: Total number of attempts that reached the COMPLETED status.
Queueing time (h): Sum of the time spent queuing by attempts that reached the COMPLETED status, in hours.
Expected consumption real (h): Sum of wallclock values for all jobs, in hours.
Expected consumption CPU time (h): Sum of the products of wallclock value and number of requested processors for each job, in hours.
Consumption real (h): Sum of the time spent running by all attempts of jobs, in hours.
Consumption CPU time (h): Sum of the products of the time spent running and number of requested processors for each job, in hours.
Consumption (%): Percentage of Consumption CPU time relative to Expected consumption CPU time.
Diagram output description#
The main stats output is a bar diagram. On this diagram, each job presents these values:
Queued (h): Sum of time spent queuing for COMPLETED attempts, in hours.
Run (h): Sum of time spent running for COMPLETED attempts, in hours.
Failed jobs (#): Total number of FAILED attempts.
Fail Queued (h): Sum of time spent queuing for FAILED attempts, in hours.
Fail Run (h): Sum of time spent running for FAILED attempts, in hours.
Max wallclock (h): Maximum wallclock value for all jobs in the plot.
Notice that the left scale of the diagram measures the time in hours, and the right scale measures the number of attempts.
Summaries output description#
Section summary
For each section, the following values are displayed:
Count: Number of completed or running jobs.
Queue Sum (h): Sum of time spent queuing for completed or running jobs, in hours.
Avg Queue (h): Average time spent queuing for completed or running jobs, in hours.
Run Sum (h): Sum of time spent running for completed or running jobs, in hours.
Avg Run (h): Average time spent running for completed or running jobs, in hours.
CSV files are also generated with the same information, in the same directory as the PDFs.
Jobs summary
For each job completed or running, the following values are displayed:
Queue Time (h): Time spent queuing for the job, in hours.
Run Time (h): Time spent running for the job, in hours.
Status: Status of the job.
CSV files are also generated with the same information, in the same directory as the PDFs.
Custom statistics#
Although Autosubmit saves several statistics about your experiment, such as the queueing time for each job, how many failures per job, etc.,
The user also might be interested in adding his particular statistics to the Autosubmit stats report (`autosubmit stats EXPID`).
The allowed format for this feature is the same as the Autosubmit configuration files: INI style. For example:
COUPLING:
LOAD_BALANCE: 0.44
RECOMMENDED_PROCS_MODEL_A: 522
RECOMMENDED_PROCS_MODEL_B: 418
The location where user can put this stats is in the file:
<experiments_directory>/<EXPID>/tmp/<EXPID>_GENERAL_STATS
Hint
If it is not yet created, you can manually create the file: expid_GENERAL_STATS inside the tmp folder.
How to extract information about the experiment parameters#
The autosubmit report command extracts the parameters and resolved values
of an experiment. It has two modes, each generating their own file, and they can be used together:
-alldumps every parameter Autosubmit knows about into a flat<expid>_parameter_list_<timestamp>.txtfile. Useful for discovery and debugging.-t <template>renders a user-supplied template, substituting%KEY%markers with the corresponding values, into<expid>_report_<timestamp>.<ext>. The output preserves the template’s extension (.md,.html,.rst, …); files without an extension default to.txt.
Both files land in the experiment’s tmp/ folder by default. Use -fp
to write them elsewhere.
The command can be called with:
autosubmit report EXPID -t "absolute_file_path"
Alternatively it also can be called as follows:
autosubmit report EXPID -all
Options:
$ autosubmit report -h

Output:
usage: autosubmit report [-h] [-t TEMPLATE] [-all] [-fp FOLDER_PATH] [-p] [-v]
                         expid

Show metrics..

positional arguments:
  expid                 experiment identifier

optional arguments:
  -h, --help            show this help message and exit
  -t TEMPLATE, --template TEMPLATE
                        Supply the metric template.
  -all, --show_all_parameters
                        Writes a file containing all parameters
  -fp FOLDER_PATH, --folder_path FOLDER_PATH
                        Allows to select a non-default folder.
  -p, --placeholders    disables the substitution of placeholders by -
  -v, --update_version  Update experiment version
What goes into the parameter list#
The flat -all output contains, in order:
Global configuration — paths,
HPCARCH, the fullPLATFORMS.*block, and the top-level YAML blocks (EXPERIMENT.*,PROJECT.*,CONFIG.*,GIT.*,SVN.*,RERUN.*,STORAGE.*,MAIL.*,DEFAULT.*).Per-section job configuration — for each job section defined in
jobs_<expid>.yml, the static YAML keys (FILE,PLATFORM,RUNNING,WALLCLOCK,ADDITIONAL_FILES) plus the runtime-resolved values (CURRENT_HOST,CURRENT_SCRATCH_DIR,JOBNAME,CHUNK,PROCESSORS, chunk dates, …).Performance metrics appended at the end, when the Autosubmit API is reachable.
For the full catalogue of variables, see the Variables reference.
Template syntax#
Autosubmit parameters are encapsulated by %KEY%, where KEY is any
parameter name from the -all output. Keys are case-insensitive, so
%HPCARCH%, %hpcarch%, and %HpcArch% all substitute to the same
value.
Dotted keys reference nested values directly: %EXPERIMENT.DATELIST%,
%PLATFORMS.MARENOSTRUM5.HOST%, %JOBS.SIM.WALLCLOCK%.
To keep a literal %KEY% in the output (no substitution), wrap it as
%%KEY%%. For example, %%PLATFORMS.MARENOSTRUM5.HOST%% in the template
renders as the literal text %PLATFORMS.MARENOSTRUM5.HOST% in the output.
Unknown placeholders render as - by default. Pass --placeholders to
leave them in the output verbatim — useful while iterating on a template,
since unmatched keys remain greppable. Autosubmit also logs a warning
listing the first unmatched keys it encountered.
Once you know how a parameter is called, you can create a template similar to the one as follows:
 === CONFIG ===
 CONFIG.AUTOSUBMIT_VERSION : %CONFIG.AUTOSUBMIT_VERSION%
 CONFIG.TOTALJOBS : %CONFIG.TOTALJOBS%
 CONFIG.SAFETYSLEEPTIME : %CONFIG.SAFETYSLEEPTIME%
 CONFIG.RETRIALS : %CONFIG.RETRIALS%

 === EXPERIMENT ===
 EXPERIMENT.DATELIST : %EXPERIMENT.DATELIST%
 EXPERIMENT.MEMBERS : %EXPERIMENT.MEMBERS%
 EXPERIMENT.CHUNKSIZEUNIT : %EXPERIMENT.CHUNKSIZEUNIT%
 EXPERIMENT.CHUNKSIZE : %EXPERIMENT.CHUNKSIZE%
 EXPERIMENT.NUMCHUNKS : %EXPERIMENT.NUMCHUNKS%
 EXPERIMENT.CALENDAR : %EXPERIMENT.CALENDAR%

 === PLATFORMS ===
 PLATFORMS.<PLATFORM_NAME>.TYPE : %PLATFORMS.<PLATFORM_NAME>.TYPE%
 PLATFORMS.<PLATFORM_NAME>.HOST : %PLATFORMS.<PLATFORM_NAME>.HOST%
 PLATFORMS.<PLATFORM_NAME>.USER : %PLATFORMS.<PLATFORM_NAME>.USER%
 PLATFORMS.<PLATFORM_NAME>.PROJECT : %PLATFORMS.<PLATFORM_NAME>.PROJECT%
This will be understood by Autosubmit and the result would be similar to:
=== CONFIG ===
CONFIG.AUTOSUBMIT_VERSION : 4.1.17
CONFIG.TOTALJOBS : 20
CONFIG.SAFETYSLEEPTIME : 10
CONFIG.RETRIALS : 0

=== EXPERIMENT ===
EXPERIMENT.DATELIST : 20000101
EXPERIMENT.MEMBERS : fc0
EXPERIMENT.CHUNKSIZEUNIT : month
EXPERIMENT.CHUNKSIZE : 4
EXPERIMENT.NUMCHUNKS : 2
EXPERIMENT.CALENDAR : standard

=== PLATFORMS ===
PLATFORMS.MARENOSTRUM4.TYPE : slurm
PLATFORMS.MARENOSTRUM4.HOST : mn1.bsc.es
PLATFORMS.MARENOSTRUM4.USER : None
PLATFORMS.MARENOSTRUM4.PROJECT : bsc32
Although it depends on the experiment.
If the parameter doesn’t exist, it will be returned as -, while if the
parameter is declared but empty, it will remain empty.
Starter template#
The template below covers the most common parameters from CONFIG,
EXPERIMENT, PLATFORMS, and the top-level namespace. It is a starting
point: add, remove, or reorder lines freely.
 # Edit this file, then run: autosubmit report <expid> -t <this_file>
 #
 # %KEY% is replaced by the value of KEY (case-insensitive).
 # %%KEY%% renders as literal %KEY% (no substitution).
 # Unknown keys become "-" (or stay verbatim with --placeholders).
 #
 # Replace <PLATFORM_NAME> below with your HPCARCH (e.g. MARENOSTRUM5, LOCAL).
 #
 # This is a starting point. Add, remove, or reorder lines freely. For the
 # full set of keys available in your experiment, run `autosubmit report
 # <expid> -all` and use the generated parameter_list file as a reference.

 === CONFIG ===
 CONFIG.AUTOSUBMIT_VERSION : %CONFIG.AUTOSUBMIT_VERSION%
 CONFIG.TOTALJOBS          : %CONFIG.TOTALJOBS%
 CONFIG.SAFETYSLEEPTIME    : %CONFIG.SAFETYSLEEPTIME%
 CONFIG.RETRIALS           : %CONFIG.RETRIALS%

 === EXPERIMENT ===
 EXPERIMENT.DATELIST       : %EXPERIMENT.DATELIST%
 EXPERIMENT.MEMBERS        : %EXPERIMENT.MEMBERS%
 EXPERIMENT.CHUNKSIZEUNIT  : %EXPERIMENT.CHUNKSIZEUNIT%
 EXPERIMENT.CHUNKSIZE      : %EXPERIMENT.CHUNKSIZE%
 EXPERIMENT.NUMCHUNKS      : %EXPERIMENT.NUMCHUNKS%
 EXPERIMENT.CALENDAR       : %EXPERIMENT.CALENDAR%

 === PLATFORMS ===
 PLATFORMS.<PLATFORM_NAME>.TYPE                : %PLATFORMS.<PLATFORM_NAME>.TYPE%
 PLATFORMS.<PLATFORM_NAME>.HOST                : %PLATFORMS.<PLATFORM_NAME>.HOST%
 PLATFORMS.<PLATFORM_NAME>.USER                : %PLATFORMS.<PLATFORM_NAME>.USER%
 PLATFORMS.<PLATFORM_NAME>.PROJECT             : %PLATFORMS.<PLATFORM_NAME>.PROJECT%
 PLATFORMS.<PLATFORM_NAME>.QUEUE               : %PLATFORMS.<PLATFORM_NAME>.QUEUE%
 PLATFORMS.<PLATFORM_NAME>.SCRATCH_DIR         : %PLATFORMS.<PLATFORM_NAME>.SCRATCH_DIR%
 PLATFORMS.<PLATFORM_NAME>.TEMP_DIR            : %PLATFORMS.<PLATFORM_NAME>.TEMP_DIR%
 PLATFORMS.<PLATFORM_NAME>.MAX_WALLCLOCK       : %PLATFORMS.<PLATFORM_NAME>.MAX_WALLCLOCK%
 PLATFORMS.<PLATFORM_NAME>.THREADS             : %PLATFORMS.<PLATFORM_NAME>.THREADS%
 PLATFORMS.<PLATFORM_NAME>.ADD_PROJECT_TO_HOST : %PLATFORMS.<PLATFORM_NAME>.ADD_PROJECT_TO_HOST%

 === TOP_LEVEL ===
 HPCARCH        : %HPCARCH%
 HPCROOTDIR     : %HPCROOTDIR%
 HPCSCRATCH_DIR : %HPCSCRATCH_DIR%
 ROOTDIR        : %ROOTDIR%
 PROJDIR        : %PROJDIR%
Save this as e.g. conf/report-template.txt and run:
autosubmit report <expid> -t conf/report-template.txt
Example output of -all:
 HPCARCH=MARENOSTRUM5
 ROOTDIR=/home/user/autosubmit/a000
 PROJDIR=/home/user/autosubmit/a000/proj
 EXPERIMENT.DATELIST=20000101
 EXPERIMENT.MEMBERS=fc0
 EXPERIMENT.CHUNKSIZEUNIT=month
 EXPERIMENT.CHUNKSIZE=1
 EXPERIMENT.NUMCHUNKS=2
 CONFIG.AUTOSUBMIT_VERSION=4.1.16
 PLATFORMS.MARENOSTRUM5.HOST=glogin1.bsc.es
 PLATFORMS.MARENOSTRUM5.QUEUE=gp_debug
 PLATFORMS.MARENOSTRUM5.SCRATCH_DIR=/gpfs/scratch
 JOBS.SIM.FILE=SIM.sh
 JOBS.SIM.WALLCLOCK=02:00
 JOBS.SIM.PROCESSORS=336
 JOBS.SIM.RUNNING=chunk
 ...
Tips#
If a row in the rendered output contains
-where you expected a value, re-run with--placeholdersto see exactly which key the renderer could not resolve.Some keys (
HPCSCRATCH_DIR, theJOBS.<section>.CURRENT_*family) are resolved at job-creation time. They may be empty for experiments that have not yet runautosubmit create.The output filename follows the template’s extension. Use
.mdfor Markdown-rendered reports,.htmlfor emailable HTML, etc.